Risks at retirement
[Photograph of two women outside with hills in the distance. The women are embracing and smiling. There is an open car trunk behind them as well as a chair.]
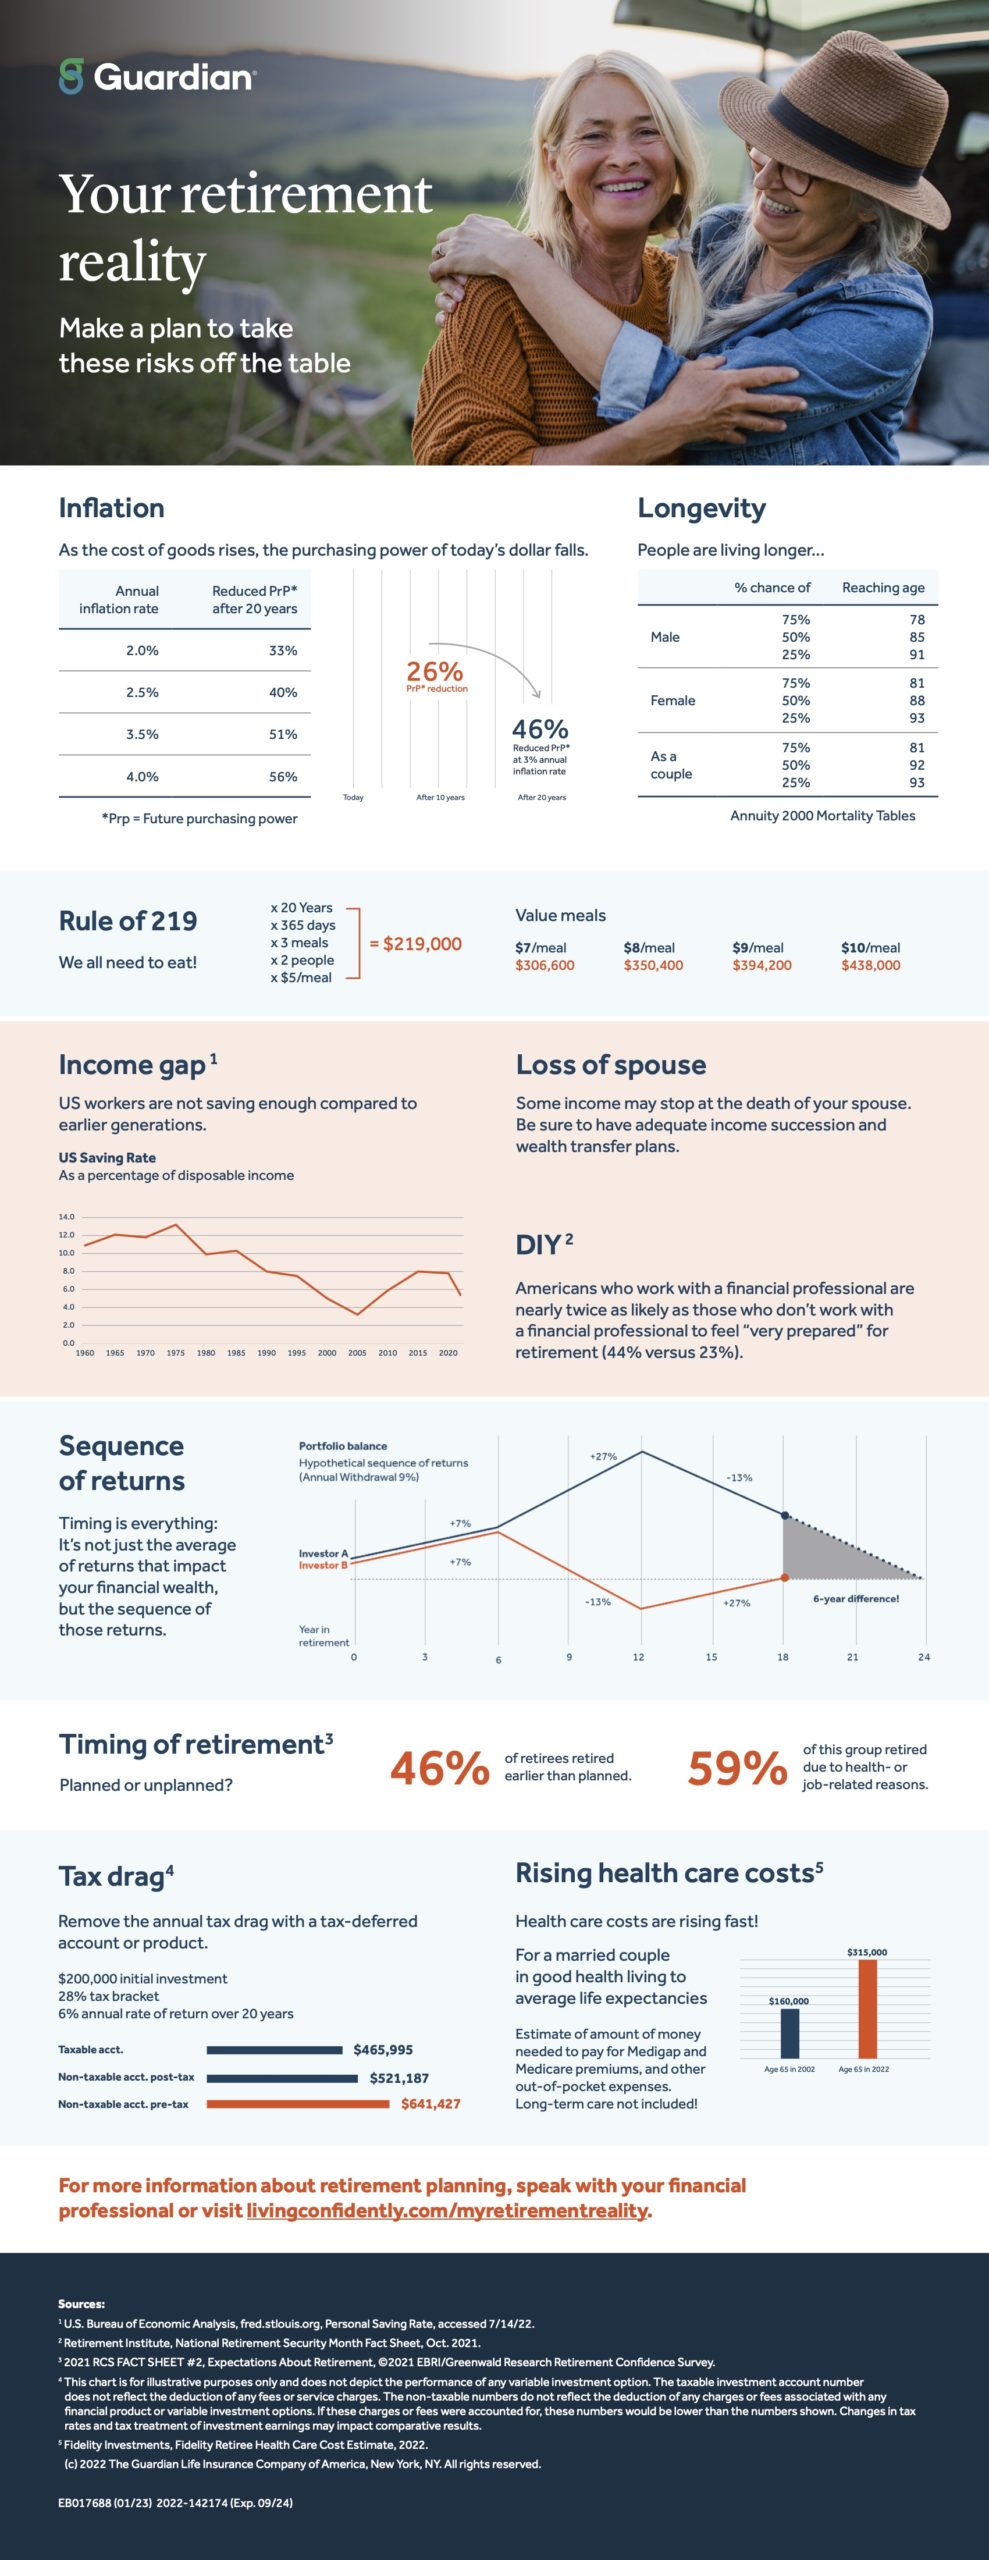
Your retirement reality
Make a plan to take these risks off the table.
Inflation
As the cost of goods rises, the purchasing power of today’s dollar falls.
[Graphic of a table with two columns labeled “Annual Inflation Rate” and “Reduced PrP* after 20 Years” Another asterisk is underneath the table, where it states, “Prp = Future purchasing power.” The table provides the information as follows.]
| Annual Inflation Rate | Reduced PrP After 20 Years |
| 2% | 33% |
| 2.5% | 40% |
| 3.5% | 51% |
| 4% | 56% |
[Graphic depicting a line graph. The x-axis on the bottom displays the values, “Today” on the left, “After 10 Years” in the middle, and “After 20 Years” on the right, all spaced apart equally. A downward curving arrow begins in the middle of the chart and extends to the right end. The beginning end of arrow is at “After 10 Years” is labeled, “26% PrP reduction,” and the pointed end at “After 20 Years” is labeled, “46% reduced PrP at 3% annual inflation rate.” An asterisk follows PrP each time, referring to the above definition of PrP as “future purchasing power.”]
Longevity
People are living longer.
[Graphic of a table providing the likelihood of reaching a certain age for males, females, and both as a couple. The numbers given are as follows:]
| % Chance of Reaching this Age | Age | |
| Males | 75% | 78 |
| 50% | 85 | |
| 25% | 91 | |
| Females | 75% | 81 |
| 50% | 88 | |
| 25% | 93 | |
| As a couple | 75% | 81 |
| 50% | 92 | |
| 25% | 93 |
Annuity 2000 Mortality Tables
Rule of 219
We all need to eat!
20 years x 365 days x 3 meals x 2 people x $5/meal = $219,000
[Graphic of a table providing the total cost for different per-meal expenses. The table is labeled “Value Meals” and provides the following information:]
| $7/meal | $306,600 |
| $8/meal | $350,400 |
| $9/meal | $394,200 |
| $10/meal | $438,000 |
Income Gap1
U.S. workers are not saving enough compared to earlier generations.
U.S. saving rate as a percentage of disposable income. [Line graph displaying the year on the x-axis and saving rate on the y-axis, showing a general decline from 1975 to 2005 and a slight uptick from 2005 to 2015. The saving rate values are displayed above each point: 12.8% for the year 1970, 13.4% for 1975, 11.1% for 1980, 9.2% for 1985, 8.4% for 1990, 7.0% for 1995, 4.8% for 2000, 3.1% for 2005, 6.6% for 2010, and 7.5% for 2015.]
Loss of Spouse2
Some income may stop at the death of your spouse. Be sure to have adequate income succession and wealth transfer plans.
DIY3
Americans who work with a financial professional are nearly twice as likely as those who don’t work with a financial professional to feel “very prepared” for retirement (44% versus 23%).
Sequence of Returns
Timing is everything: It’s not just the average of returns that impact your financial wealth, but the sequence of those returns.
[Line graph labeled “Portfolio balance: Hypothetical Sequence of Returns (Annual Withdrawal 9%).” The x-axis is labeled “Year in retirement” and along the axis are values from 0 to 24, increasing by 3s. Two lines are plotted on the graph: a blue line labeled “Investor A” and an orange line labeled “Investor B.” From years 0 to 6, both lines are side-by-side at the same height and this section is labeled “+7%” on each line. From years 6 to 12, the “Investor A” line slopes upward and reaches peak height, and this section of the line is labeled, “+27%,” while the “Investor B” line slopes downward and reaches its lowest height at a point below the starting position and is labeled “-13%.” From years 12 to 18, the “Investor A” line slopes downward and this section is labeled, “-13%,” while the “Investor B” line slopes upward and this section is labeled “+27%.” Both solid lines end at Year 18, and the “Investor A” line only continues downward as a dotted line until it meets the x-axis at Year 24. The triangular area under the “Investor A” line under the dotted section of the line is shaded in gray and labeled, “6-year difference!”]
Timing of Retirement
Planned or unplanned?
46% of retirees retired earlier than planned.
59% of this group retired due to health or job-related reasons.
Tax Drag4
Remove the annual tax drag with a tax-deferred account or product.
$200,000 initial investment, 28% tax bracket, 6% annual rate of return over 20 years. [Graphic of three stacked horizontal lines. The top line is the shortest and is labeled, “Taxable acct.” Beside this line, the value “$465,995.” The line in the middle is middling in length and labeled, “Non-taxable acct. post-tax.” Beside this line is the value “$521,187.” The bottom line is the longest and labeled, “Non-taxable acct. pre-tax,” with the value “$641,427” printed beside it.
Rising Health Care Costs5
Health care costs are rising fast!
For a married couple in good health living to average life expectancies: Estimate of amount of money needed to pay for Medigap and Medicare premiums, and other out-of-pocket expenses. Long-term care not included!
[Graphic of bar graph with two vertical bars. The shorter blue bar is labeled, “Age 65 in 2002” on the bottom axis and has “$160,000” printed on top. The longer orange bar is labeled, “Age 65 in 2022,” on the bottom axis and has “$315,000” printed on top.]
For more information about retirement planning, speak with your financial professional or visit www.LivingConfidently.com/MyRetirementReality.
Sources:
1U.S. Bureau of Economic Analysis, fred.stlouis.org, Personal Saving Rate, accessed 7/14/22.
2Retirement Institute, National Retirement Security Month Fact Sheet, Oct. 2021.
32021 RCS FACT SHEET #2, Expectations About Retirement, ©2021 EBRI/Greenwald Research Retirement Confidence Survey.
4This chart is for illustrating purposes only and does not depict the performance of any variable investment option. The taxable investment account number does not reflect the deduction of any fees or service charges. The non-taxable numbers do not reflect the deduction of any charges or fees associated with any financial product or variable investment options. If these charges or fees were accounted for, these numbers would be lower than the numbers shown. Changes in tax rates and tax treatment of investment earnings may impact comparative results.
5Fidelity Investments, Fidelity Retiree Health Care Cost Estimate, 2022.
© 2022 The Guardian Life Insurance Company of America, New York, NY. All rights reserved.
EB017688 (09/22) 2020-142174 (Exp. 09/24)
Living Confidently is powered by The Guardian Network.